A few (thousand) words on income inequality
Well known Hedge Fund Manager Ray Dalio recently explained how monetary policy has impacted financial assets in a good piece here. This post is dedicated to explaining how those same dynamics have contributed to Income Inequality. For some reason this gets lost in what's obviously a really important debate.
Specifically, these financial dynamics are the extension of a trend we've seen in US financial policy since the 1980s, when the income growth of the super-rich really began accelerating away from everyone else. Markets have increased significantly, and people whose pay is connected to markets make significantly more, but we don't discuss that there might be some connection...
Specifically, these financial dynamics are the extension of a trend we've seen in US financial policy since the 1980s, when the income growth of the super-rich really began accelerating away from everyone else. Markets have increased significantly, and people whose pay is connected to markets make significantly more, but we don't discuss that there might be some connection...
"Interest rates are to asset prices what gravity is to the apple. When there are low interest rates, there is a very low gravitational pull on asset prices." – Warren Buffett
In addition to the traditional causes people mention –
manufacturing, technology, unions, and globalization – the US has pursued a four-decade-straight
run of bringing down interest rates and increasing pro-cyclical government
spending via debt.
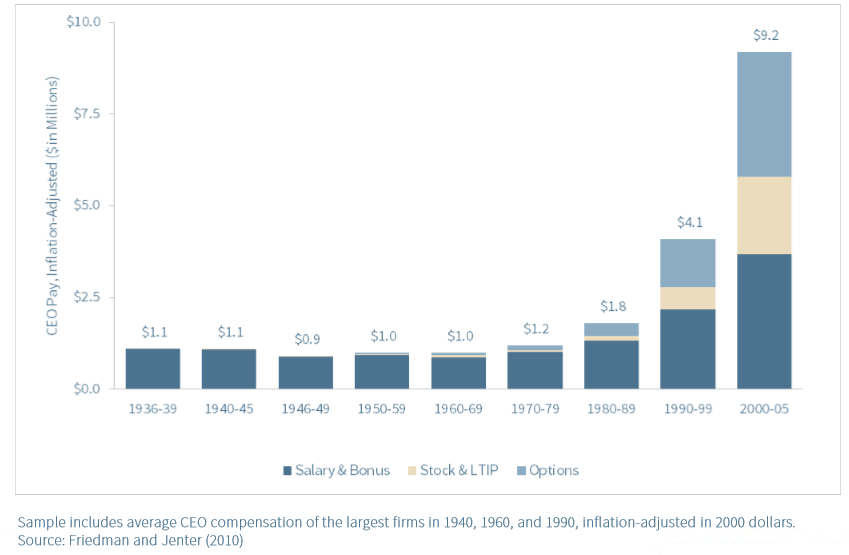
In the intervening decades, financial professionals and
executives – people who buy stock and get paid in stock – have seen their annual
incomes skyrocket relative to other professions [1]. Yet we’re more likely to
see that phenomenon attributed to some ‘rock star’ theory of compensation than
a much simpler one: our one-directional monetary and fiscal policy has had a
direct long run impact on significant determinants of their pay.

(Source: https://www.census.gov/data/tables/time-series/demo/income-poverty/historical-income-households.html)

From 1980 to now, the stock market, as an example, has done
exactly what one would expect as rates fell from 20% in 1980 to almost 0% now and
debt-driven spending increased; it’s appreciated enormously, at a faster rate
than it had before that.
The Fed was continuously pushing up the price of risk-free
bonds, so the market continuously pushed up the price it would pay for the cash
returns of every other financial asset. The Schiller price-to-earnings ratio expanded
from sub-10 in 1980 to above-25 now [2]. Just look at the chart below.
All anyone needed to do in most years between then and now
was to manage financial assets or get paid in them (stocks or stock options) to
start making a disproportionate amount of money relative to the rest of the
country.
It turns out financial professionals and executives explain
70% of the top 0.1%’s growth in income from 1979 – 2005. 60% for the top 1% [3].
With the policy we pursued, it should not be surprising to
hear that there was an acceleration in the financial services industry starting
in 1980, driven primarily by asset management and household credit [4].
And it shouldn’t be surprising that salaries for the “typical”
financial services employee went from average vs other industries in 1980 to
70% more on average by 2006 [4]. Borrowing increases at lower interest rates, and
savings find their way to the riskier asset classes managed by ”financial
professionals”.
Some speak about income inequality with a solemn resignation
that our adherence to a free market is what got us here. What I would propose
is that our current situation is not
the true outcome of a free market but at least in part the ironic result of our
intervention. We thought we could manage the outcomes of an extremely complex
system without any unintended consequences or pain, and we were wrong.
Every time we were presented with the need to borrow less or
absorb a correction, we chose the easier way out. Had we not pursued this path,
the post-1980 appreciation of financial asset values would not have been as
extreme and the incomes of certain professions would not be so high relative to
similarly educated people.
I’m not the first to make this argument, but some of the
executives and financial personnel who have become so rich since 1980 seem to
have been – to varying degrees obviously – beneficiaries of circumstance. (I
used to work with some of them).
Outline of the rest
of the post:
1) a quick overview
of what has happened to incomes for the very rich;
2) an explanation of
why interest rates affect the long-term valuations of financial assets;
3) how financial
asset valuations impact the compensation of asset managers, executives, bank
employees, and people in real estate;
What recent income inequality looks like - biased towards the very top & biased towards those whose pay is linked to financial asset values

Jon Bakija, Adam Cole, and Bradley T. Heim arranged a comprehensive breakdown of this group’s income by occupation, classifying all into the following groups for the years 1979-2005:
- Executives, managers, and supervisors (non finance)
- Finance (including finance management)
- Lawyers
- Medical
- Real Estate
- Skilled sales (but not finance or real estate)
- Arts, media, and sports
- Entrepreneur not elsewhere classified
- Computer, math, engineering, technical
- Business operations (nonfinance)
- Professors and scientists
- Farmers and ranchers
- Pilots
- Government, teachers, social services
- Blue collar or low-skill
- The share of national annual income going to the top 1 percent increased from 9.72 percent to 20.95 percent.
- The share of national income going to the top 0.1 percent increased from 3.30 percent in 1979 to 10.34 percent in 2005

Certain occupations – ones that benefitted from the financial trends mentioned above – drove the majority of this increase. Corporate executives/managers and financial professionals alone explain 60 of this growth for the top 1% and 70% for the top 0.1%. Look at the magnitude of them vs any other occupation in the chart below:

There were increases elsewhere, but the ones accruing to the executive and finance categories are dominant, occurring in lock step with the stock market.
Per Bakija, Cole, and Heim:
- Financial professional income increased “particularly dramatically during the stock market boom between 1993 and 2001” before falling “precipitously in 2002 and 2003”, and then “recovering along with the stock market and the economy to new heights in 2004 and 2005.”
- “People in real estate experienced an extremely sharp increase in incomes between 2003 and 2005 as the housing market bubble took off,” while “executives and managers also exhibit substantial sensitivity to the business cycle and stock market.”
- The incomes of lawyers and medical professionals were “relatively insensitive to those [market] factors”.
1: Interest rates are a significant contributor to
financial asset values
The long-term value of financial assets is a function of
interest rates. Any finance textbook includes the Capital Asset Pricing Model that
explains this.
In simpler terms, for purely financial reasons, why would you
lend a stranger money at 7% if you could get an insured savings account at your
bank that also pays 7%? You would need a higher return to take that risk.
But when the interest rate on that savings account goes down,
maybe you reconsider the risk of the loan to the stranger, if it means you can get
a better return. If all of a sudden savings account rates are offering interest
rates of 0%, you might even have competition to lend to him at 3%. This is how
financial markets work; assets are broadly priced in terms of their risk
relative to one another, starting with US Treasuries.
Bringing down rates so consistently – and in such a way as
to minimize any market correction – has consistently increased the market’s
propensity to move to riskier places in search of returns.
Whereas the market would not pay more than $10 for a $1 of corporate
earnings in 1980, it now is willing to pay over $28 [6]. It is not a coincidence
that we’re also seeing such big and bold investment in high-valued startups (like
WeWork). It is all part of the same risk curve, starting with the pricing of “risk-free
assets”, which the Fed has continuously raised.
(There is a separate argument to be made that these gains benefitted those owning financial assets at the expense of future savers in younger generations, but that is out of scope for now).

This price-to-earnings ratio expansion is an undeniable contributor to the market’s excellent performance the last 4 decades, along with a Fed that proactively intervened to combat market declines. Market returns would not be the same if the P/E ratio expanded less.
Clearly, technology and other trends contributed to earnings growth that also helped drive market returns, but it’s worth pointing out that higher corporate leverage and lower interest rates were significant contributors to the expansion in broader profit margins. The legendary investor Jeremy Grantham wrote that they were the single largest input into recent margin expansion vs pre-1997 levels[7].

2a: Financial asset values are a significant contributor
to the annual compensation of asset managers
The average financial asset manager is paid based on the
amount he or she manages and, often, the amount that those assets appreciate
that year. Both of these factors benefit from a rising market.
As one might expect with interest rates falling, consumer
savings deposits relative to GDP declined from 70% at the beginning of the
1980’s to under 50% by the early 2000s, reflecting “a shift of saving into
money market funds, bond funds, and the stock market.”[8]
This plus the extreme positive performance of both the stock
and the bond markets drove a multi-decade run for the emerging asset management
industry. The inflows of foreign capital we invited with our growing fiscal deficits undoubtedly contributed too[9].
 (Chart: Robin Greenwood and David Scharfstein “The Growth of Finance”)
There were only 68 Hedge Funds open in 1984. But by the end of 1999, it was estimated that there were 4,000 [10].
There were only 68 Hedge Funds open in 1984. But by the end of 1999, it was estimated that there were 4,000 [10].

Many asset managers really did not even have to outperform the
market to earn significant fees. Even today, this is why most portfolio
managers paradoxically invest in the same stocks/bonds as their peers. While
you would think that outperforming those peers would require an effort to
purchase different things, most money managers aren’t interested in
outperforming anyone as much as they are interested in not sticking out their
neck, so they won’t make any glaring mistakes and suffer withdrawals.
2b: Financial asset values are a significant contributor
to the annual compensation of executives and managers

Most stock options have historically been issued at the current
market price with a ten-year duration. It’s been hard to find precise data on
the percentage of historical option plans that were granted as “fixed value” or
“fixed number”, but what I have found suggests both are/were popular [13].
“Fixed value” grants adjust the number of options given to
an employee to deliver a consistent monetary amount. “Fixed number” plans, on
the other hand, give an employee a set number of options, with no promises with
regard to eventual value.
These “fixed number” plans can confer a significant amount
of unexpected value to employees in a rising market.
Let’s say you were given a fixed number grant of 100,000 options
at the current market price of $10 in 1994. In any three average years, you
might expect the stock market to appreciate 7% per year and the company’s stock
to appreciate to $12.25, earning you $225,000.
But what actually happened in those three years was the
market almost doubled. Just by doing no worse than the market, (ie completely average),
your company’s stock is worth $20; you can exercise the options and make $1,000,000…
or maybe you wait 2 more years and make $500,000 more (market kept rising!).
Now, consider that executive pay is often reported in the media
in gross dollar terms. If this $1,000,000 becomes the basis for comparison vs
your peers, just think about what this could do in terms of setting a bar for executive
compensation! Prospective employees with more experience might want more.
In a year where some executives are making that much money, even
the firms giving “fixed value” options now need to consider raising the
value of their grants, if they want to recruit top candidates.
And “fixed number” firms basically have to increase
the number of options they give new employees because a) they will feel
pressure to keep up with the going market rate in dollar terms if they want to
hire top talent, and b) no top talent will take you seriously if you give
him or her a small number of options and tell them the market will double again
in 3 years. If a CEO candidate comes to you and wants $1,000,000 because
that is what your outgoing CEO made, and you tell him you will give him the
same number of “fixed options” – effectively that he has to double the price of
the stock to make the same – it is likely he accepts a job elsewhere.
And if you think that ’94-’97 run in the market was unique, there
were plenty of other stretches during this 40 years where the market went up
more than you’d expect in a multi year span. https://www.macrotrends.net/2526/sp-500-historical-annual-returns
Or the sensitivity of CEO pay to their company’s stock price[15]:

And how compensation moved with the market[16]:

Obviously, there was a significant amount of value created
by the technologies and companies that emerged from 1980 to today. Certainly,
many key executives deserved to be paid well. However, no financial asset was
completely isolated from the trends of the broader market.
If we agree that the financial paradigm contributed to even
some of the excessive movements in the stock market (late 1990’s, or 2007), it
then would appear to have been a lever for executive compensation. Even without
operational results that exceeded peers, the stock and options of executives
appreciated significantly, increasing their reported incomes and ratcheting up expectations
for the next sought-after job seeker. When market valuations corrected, the
value of the stock based compensation declined. But the Federal Reserve intervened
to get stock prices moving upward again. In fact, the actions and commentary of the Greenspan-led Federal Reserve seem to have been exceptionally focused/preoccupied with any severe correction in financial markets [17].
3: Interest rates are a direct contributor to real estate
value because most real estate is purchased via loan
This is a quick one: whether it’s an apartment building, a
commercial building, or a house, real estate is usually purchased with debt.
Lower interest rates and more available debt allowed real
estate owners or investors to do a number of profitable things. For example, if
you bought a building, lower interest rates allowed you to refinance and pay
lower interest, increasing your cash flow and raising the valuation of the
property. Or with banks looking to increase their risk profile, they might just
lend you the money to buy a new building.
Real Estate agents make money from commissions, which are
based on sale values. Investors make money on appreciation, rent increases, and
cost decreases. It is undeniable that interest rates have been an effectively non-stop
positive influence on the industry.
4: Falling interest rates entice consumers to borrow more.
Robin Greenwood and David Scharfstein’s 2013 investigation
into the growth of finance highlighted that the financial industry really emerged
in 1980, driven primarily by asset management (previously discussed) and
household credit, which went from 48% of GDP in 1980 to 99% by 2007[18].
I wrote earlier about how consumer savings deposits relative
to GDP declined from 70% at the beginning of the 1980’s to under 50% by the
early 2000s. This and the increase in consumer borrowing are two things are extremely
predictable long-term outcomes of the financial policy we’ve pursued[19].
Greenwood and Scharfstein write “This growth was not simply
the continuation of a trend that started in the 1950’s; rather, something
appears to have changed in the early 1980’s… This growth is apparent whether
one measures the financial sector by its share of GDP, by the quantity of
financial assets, by employment, or by its average wages.”[20]
I think most investment bankers would admit that the pro-cyclical
policy has been beneficial to other areas (trading revenues, M&A / debt
advisory), but it shouldn’t be hard to see how a larger and more profitable
industry might also drive higher incomes. In 2008, “28 percent of Harvard
Graduates went into Financial Services, compared to only 6% between 1969 and
1973.” [21]
Sources:
1. Jon Bakija, Adam Cole, Bradley T. Heim “Jobs and Income Growth of Top Earners and the Causes of Changing Income Inequality: Evidence from U.S. Tax Return Data”, April 2012.
2. http://www.econ.yale.edu/~shiller/data.htm
3. Jon Bakija, Adam Cole, Bradley T. Heim “Jobs and Income Growth of Top Earners and the Causes of Changing Income Inequality: Evidence from U.S. Tax Return Data”, April 2012.
4. Robin Greenwood and David Scharfstein “The Growth of Finance” Journal of Economic Perspectives—Volume 27, Number 2—Spring 2013—Pages 3–28
5. Jon Bakija, Adam Cole, Bradley T. Heim “Jobs and Income Growth of Top Earners and the Causes of Changing Income Inequality: Evidence from U.S. Tax Return Data”, April 2012.
6. http://www.econ.yale.edu/~shiller/data.htm
7. https://www.gmo.com/americas/research-library/this-time-seems-very-very-different/
8. Robin Greenwood and David Scharfstein “The Growth of Finance” Journal of Economic Perspectives—Volume 27, Number 2—Spring 2013—Pages 3–28
9. "Capitalizing on Crisis: The Political Origins of the Rise of Finance" Greta R. Krippner 2011.
10. https://iamgroup.ca/doc_bin/The%20History%20of%20Hedge%20Funds%20-%20The%20Millionaires%20Club.pdf
11. Carola Frydman and Raven E. Saks “Executive Compensation: A New View from a Long-Term Perspective, 1936–2005” April 16, 2010
12. Lawrence Mishel and Alyssa Davis “CEO Pay Continues to Rise as Typical Workers are Paid Less” June 12, 2014
13. https://hbswk.hbs.edu/item/stock-options-are-not-all-created-equal
14. https://www.gsb.stanford.edu/faculty-research/publications/ceo-compensation-data
15. https://www.gsb.stanford.edu/faculty-research/publications/ceo-compensation-data
16. Lawrence Mishel and Alyssa Davis “CEO Pay Continues to Rise as Typical Workers are Paid Less” June 12, 2014
17. "Capitalizing on Crisis: The Political Origins of the Rise of Finance" Greta R. Krippner 2011.
18. Robin Greenwood and David Scharfstein “The Growth of Finance” Journal of Economic Perspectives—Volume 27, Number 2—Spring 2013—Pages 3–28
19. Robin Greenwood and David Scharfstein “The Growth of Finance” Journal of Economic Perspectives—Volume 27, Number 2—Spring 2013—Pages 3–28
20. Robin Greenwood and David Scharfstein “The Growth of Finance” Journal of Economic Perspectives—Volume 27, Number 2—Spring 2013—Pages 3–28
21. http://pubs.aeaweb.org/doi/pdfplus/10.1257/jep.27.2.3
I appreciate your efforts which you have put into this article. This post provides a good post about compensation. Genuinely, it is a useful article to increase our knowledge. Thanks for sharing such articles here.CEO Compensation Consultant
ReplyDeleteExcellent job, this is necessary information which is shared by you. This information is meaningful and very important for us to increase our knowledge about it. Always keep sharing this type of information. Thanks. bay area compensation consulting company
ReplyDeleteA Beginners' Guide to Baccarat and Other Basic Strategies
ReplyDeleteLearn the basic rules 실시간 바카라 사이트 샤오 미 of Baccarat, the game of the standard card game of Baccarat. You will have two or three hands, but you will not
The consistency and the thoughtfully chosen, repairable parts of the Prusa Mini+ will please more advanced users who want a reliable 3D-printing machine. It’s additionally a discount, with uncommon options at this price such as a large, 7-by-7-by-7-inch printing area and a color show, nicely as|in addition to} 24/7 buyer assist. Prusa printers are the quietest fashions we’ve tested, Direct CNC too, and they’re compatible with broad range|a variety} of plastic types.
ReplyDeleteYou did an excellent job in sharing this important information. This information is significant and necessary for us to learn more about it. Continue to share this type of information. Thanks farm inventory management software
ReplyDelete